Corn isn’t just another crop, it’s the backbone of U.S. agriculture, livestock feed, ethanol production, and global exports. Looking back at the last 50 years of corn prices helps farmers understand how weather, policy, and world events have shaped the market and how those lessons can guide decisions today.
Corn Prices Over the Last 50 Years
Late 1970s Boom → Early 1980s Bust
What happened: A global grain squeeze and export surge in the 1970s pushed corn prices up. But by the early 1980s, high interest rates and overexpansion triggered the Farm Crisis, leaving many farmers squeezed.
Lesson: Leverage can hurt in down cycles. Cash flow and storage flexibility make survival possible.
The Long Flat 1990s
What happened: Strong yields and steady global supplies kept prices relatively stable.
Lesson: Productivity gains cap rallies unless disrupted by major shocks.
2006-2013: Ethanol and the Drought Spike
What happened: The Renewable Fuel Standard sharply increased demand for corn, sending prices higher. Then the 2012 drought—the worst in 50 years—pushed corn to record levels above $8/bushel.
Lesson: Policy shifts can change long-term demand, but weather still dictates short-term extremes.
2014-2019: Abundance and Trade Frictions
What happened: Large U.S. harvests and global competition, combined with U.S.–China trade tensions, kept prices choppy and often subdued.
Lesson: Geopolitics and global competitors increasingly set the price floor.
2020-2023: Pandemic Whiplash → Big Crops
What happened: Pandemic logistics, inflation, and surges in Chinese buying pushed prices up in 2021–22. But record crops in 2023 sent inflation-adjusted prices back to near two-decade lows.
Lesson: Volatility is the new normal. Preparedness matters more than prediction.
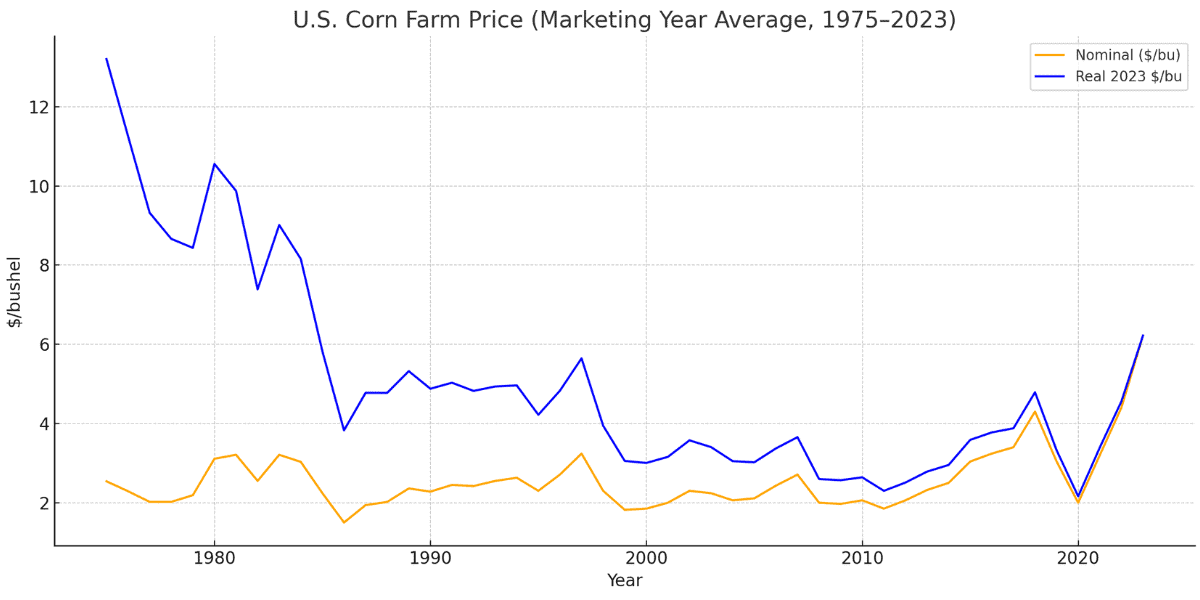
Nominal vs. Real Corn Prices (1975-2023)
This chart compares nominal farm prices (what farmers were paid at the time) with real, inflation-adjusted prices (2023 dollars). While nominal prices show big spikes, the real trendline reveals how inflation eroded gains and how rare true rallies have been.
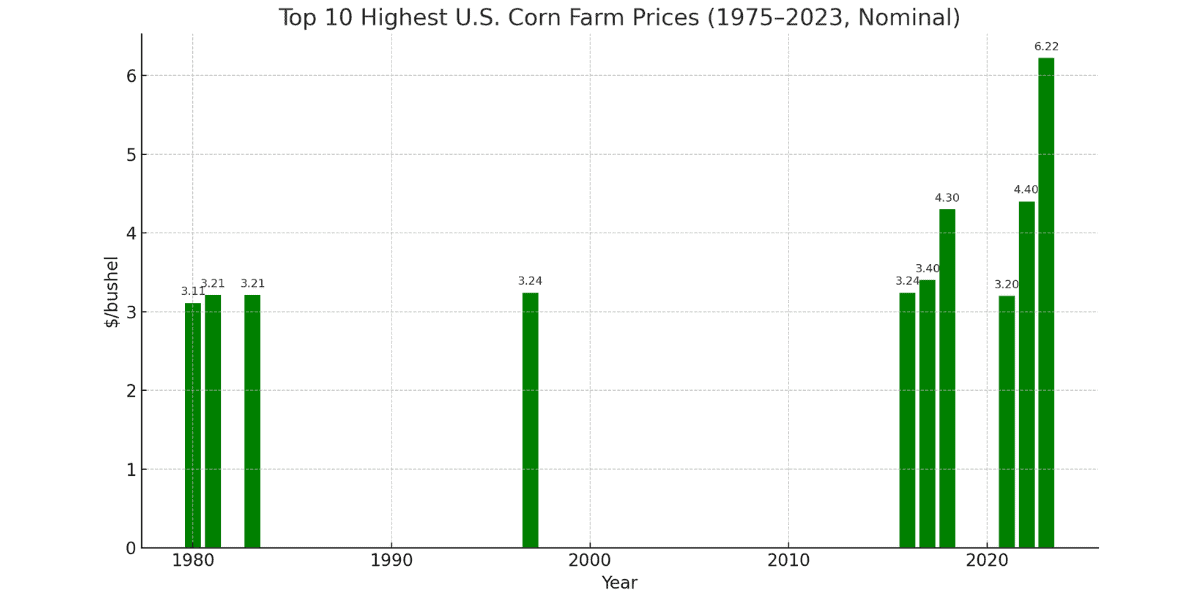
Top 10 Highest Corn Price Years (1975-2023)
Corn’s most expensive years line up with well-known crises: the 2012 drought, the ethanol demand boom of the late 2000s, and the COVID-era disruptions of 2021–22.
What Drives Corn Price Swings?
Weather: Droughts (like 2012) slash yields and spike prices
Policy: The Renewable Fuel Standard reshaped demand in the 2000s.
Global Demand: Exports to China and competition from Brazil and the Black Sea shift US prices.
Stocks & Acreage: Large crops and high ending stocks weigh on prices.
Inflation & Interest Rates: Even “high” prices may feel weak once adjusted for costs.
💡 Did You Know? In 2012, the worst drought in 50 years pushed corn futures to over $8.00/bushel—the highest nominal price ever recorded.
What History Teaches Farmers Today
Expect volatility, plan accordingly – Rallies don’t last, be ready for cycles.
Real prices matter more than nominal – Benchmark against todays dollars.
Storage is strategic – Farmers who could hold grain often sold into better markets.
Risk management is survival – Insurance, forward contracts, and future are tools against uncertainty.
Protect what you’ve already grown – Lost grain equals lost opportunity, especially in thin-margin years.
Conclusion
Corn prices will always rise and fall, but history shows that preparedness makes the difference between profit and loss. While no farmer can control markets, every farmer can protect the grain they’ve worked so hard to produce.
At West Side Salvage, we help farmers safeguard their investment with emergency response, salvage services, and safe storage solutions. Because when every bushel counts, losing grain is not an option.